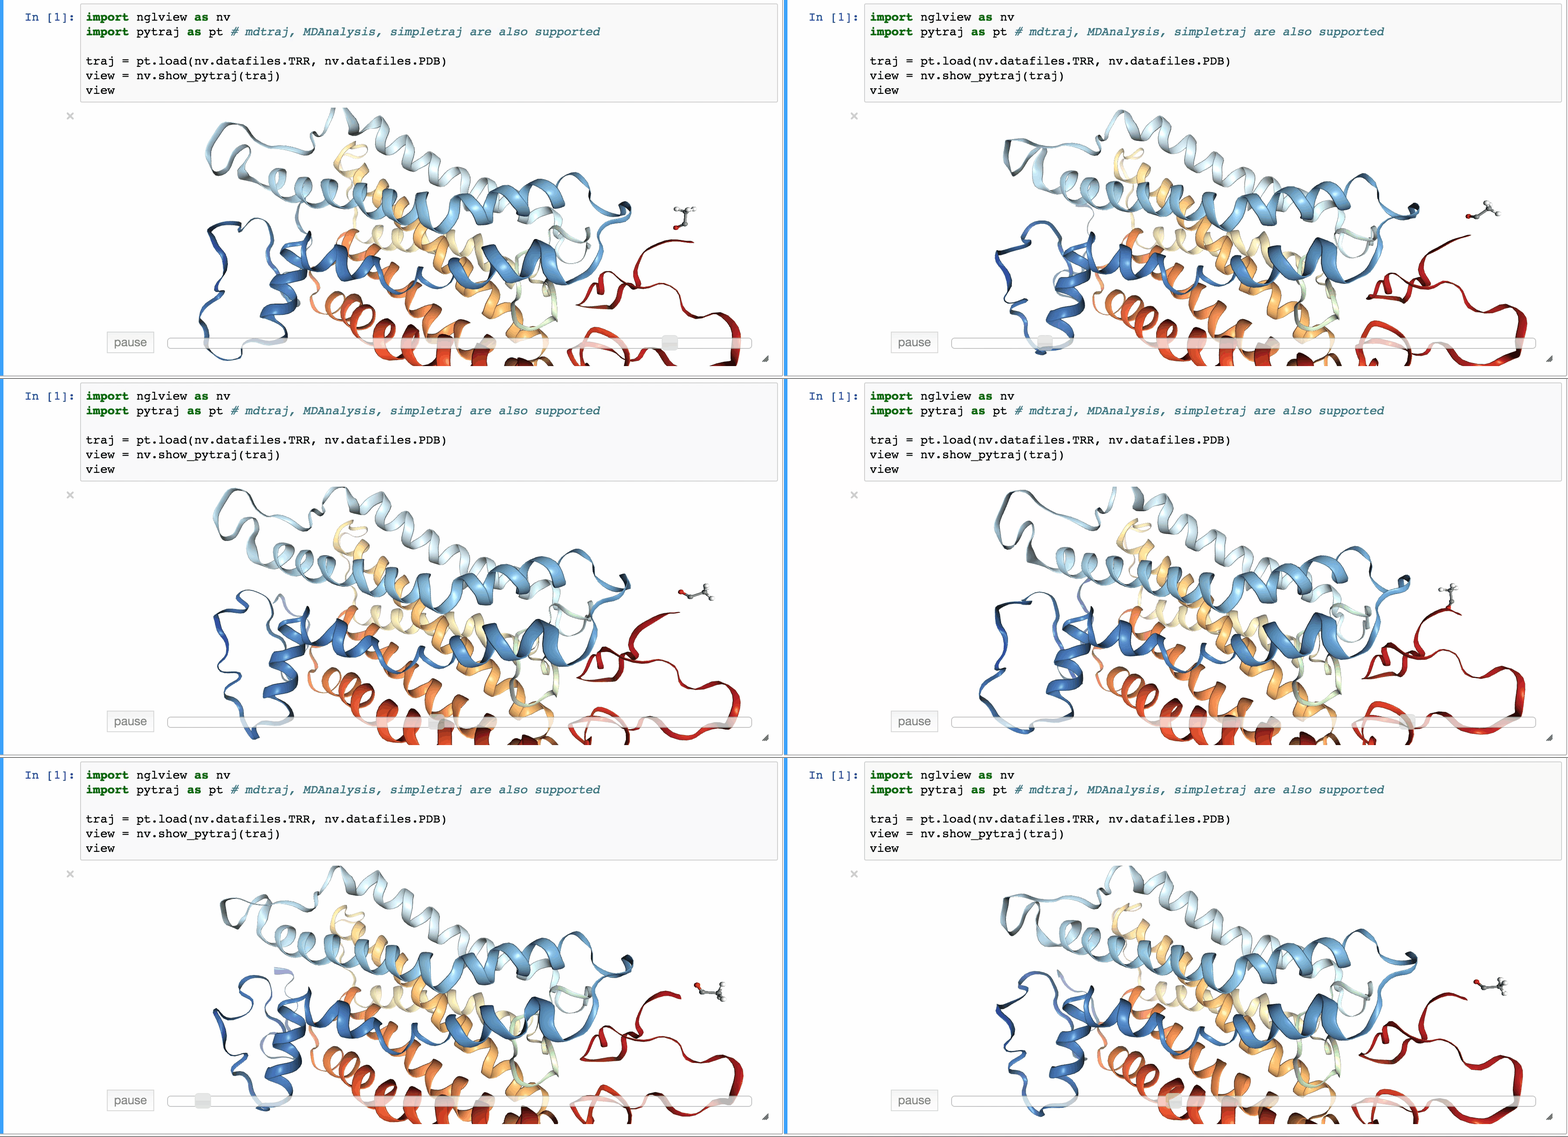
An IPython/Jupyter widget to interactively view molecular structures and trajectories. Utilizes the embeddable NGL Viewer for rendering. Support for showing data from the file-system, RCSB PDB, simpletraj and from objects of analysis libraries mdtraj, pytraj, mdanalysis.
Should work with Python 2 and 3. If you experience problems, please file an issue.

nglview
Table of contents
Installation
Released version
Available on
biocondachannelconda install nglview -c biocondaAvailable on PyPI
pip install nglview
Development version
The development version can be installed directly from github:
python -m pip install git+https://github.com/arose/nglview
If for any reasons that the widget is not shown, try reinstall below
packages
conda install traitlets=4.2.1 ipywidgets==4.1.1 notebook=4.1.0
Example
Please see our Jupyter notebook examples
Usage
Open a notebook
jupyter notebook
and issue
import nglview
view = nglview.show_pdbid("3pqr")  # load "3pqr" from RCSB PDB and display viewer widget
view
A number of convenience functions are available to quickly display data from the file-system, RCSB PDB, simpletraj and from objects of analysis libraries mdtraj, pytraj, mdanalysis, ParmEd.
| Function | Description |
|---|---|
show_structure_file(path) |
Shows structure (pdb, gro, mol2, sdf) in path |
show_pdbid(pdbid) |
Shows pdbid fetched from RCSB PDB |
show_simpletraj(struc_path, traj_path) |
Shows structure & trajectory loaded with simpletraj |
show_mdtraj(traj) |
Shows MDTraj trajectory traj |
show_pytraj(traj) |
Shows PyTraj trajectory traj |
show_parmed(structure) |
Shows ParmEd structure |
show_mdanalysis(univ) |
Shows MDAnalysis Universe or AtomGroup univ |
API
Representations
view.add_representation(repr_type='cartoon', selection='protein')

# or shorter
view.add_cartoon(selection="protein")
view.add_surface(selection="protein", opacity=0.3)

# specify color
view.add_cartoon(selection="protein", color='blue')

# specify residue
view.add_licorice('ALA, GLU')

# clear representations
view.clear_representations()
...
And many more, please check Selection language
Representations can also be changed by overwriting the
representations property of the widget instance view. The
available type and params are described in the NGL Viewer
documentation.
view.representations = [
    {"type": "cartoon", "params": {
        "sele": "protein", "color": "residueindex"
    }},
    {"type": "ball+stick", "params": {
        "sele": "hetero"
    }}
]
The widget constructor also accepts a representation argument:
initial_repr = [
    {"type": "cartoon", "params": {
        "sele": "protein", "color": "sstruc"
    }}
]

view = nglview.NGLWidget(struc, representation=initial_repr)
view
Properties
# set the frame number
view.frame = 100
# parameters for the NGL stage object
view.parameters = {
    # "percentages, "dist" is distance too camera in Angstrom
    "clipNear": 0, "clipFar": 100, "clipDist": 10,
    # percentages, start of fog and where on full effect
    "fogNear": 0, "fogFar": 100,
    # background color
    "backgroundColor": "black",
}

# note: NGLView accepts both origin camel NGL keywords (e.g. "clipNear")
# and snake keywords (e.g "clip_near")
# parameters to control the `delay` between snapshots
# change `step` to play forward (positive value) or backward (negative value)
# note: experimental code
view.player.parameters = dict(delay=0.04, step=-1)
# update camera type
view.camera = 'orthographic'
# change background color
view.background = 'black'
Trajectory
# adding new one
view.add_trajectory(traj)

# traj could be `pytraj.Trajectory`, `mdtraj.Trajectory`, `MDAnalysis.Universe`, `parmed.Structure`
# change representation
view.trajectory_0.add_cartoon(...)
view.trajectory_1.add_licorice(...)
Add extra component
# Density volumes (MRC/MAP/CCP4, DX/DXBIN, CUBE)
view.add_component('my.ccp4')
Multiple widgets
You can have multiple widgets per notebook cell:
from ipywidgets.widgets import Box
w1 = NGLWidget(...)
w2 = NGLWidget(...)
Box(children=(w1,w2))
API doc
License
Generally MIT, see the LICENSE file for details.


